 Scientify
RMSE vs experiment
Sampling
Compute
Simulated system
Solute, water and the periodic box
Scientify rendered these conformations with PyMOL on its cloud computer, using the last frame of the λ = 0 production run. The solute is centred and each water is shown at the periodic image nearest to it.
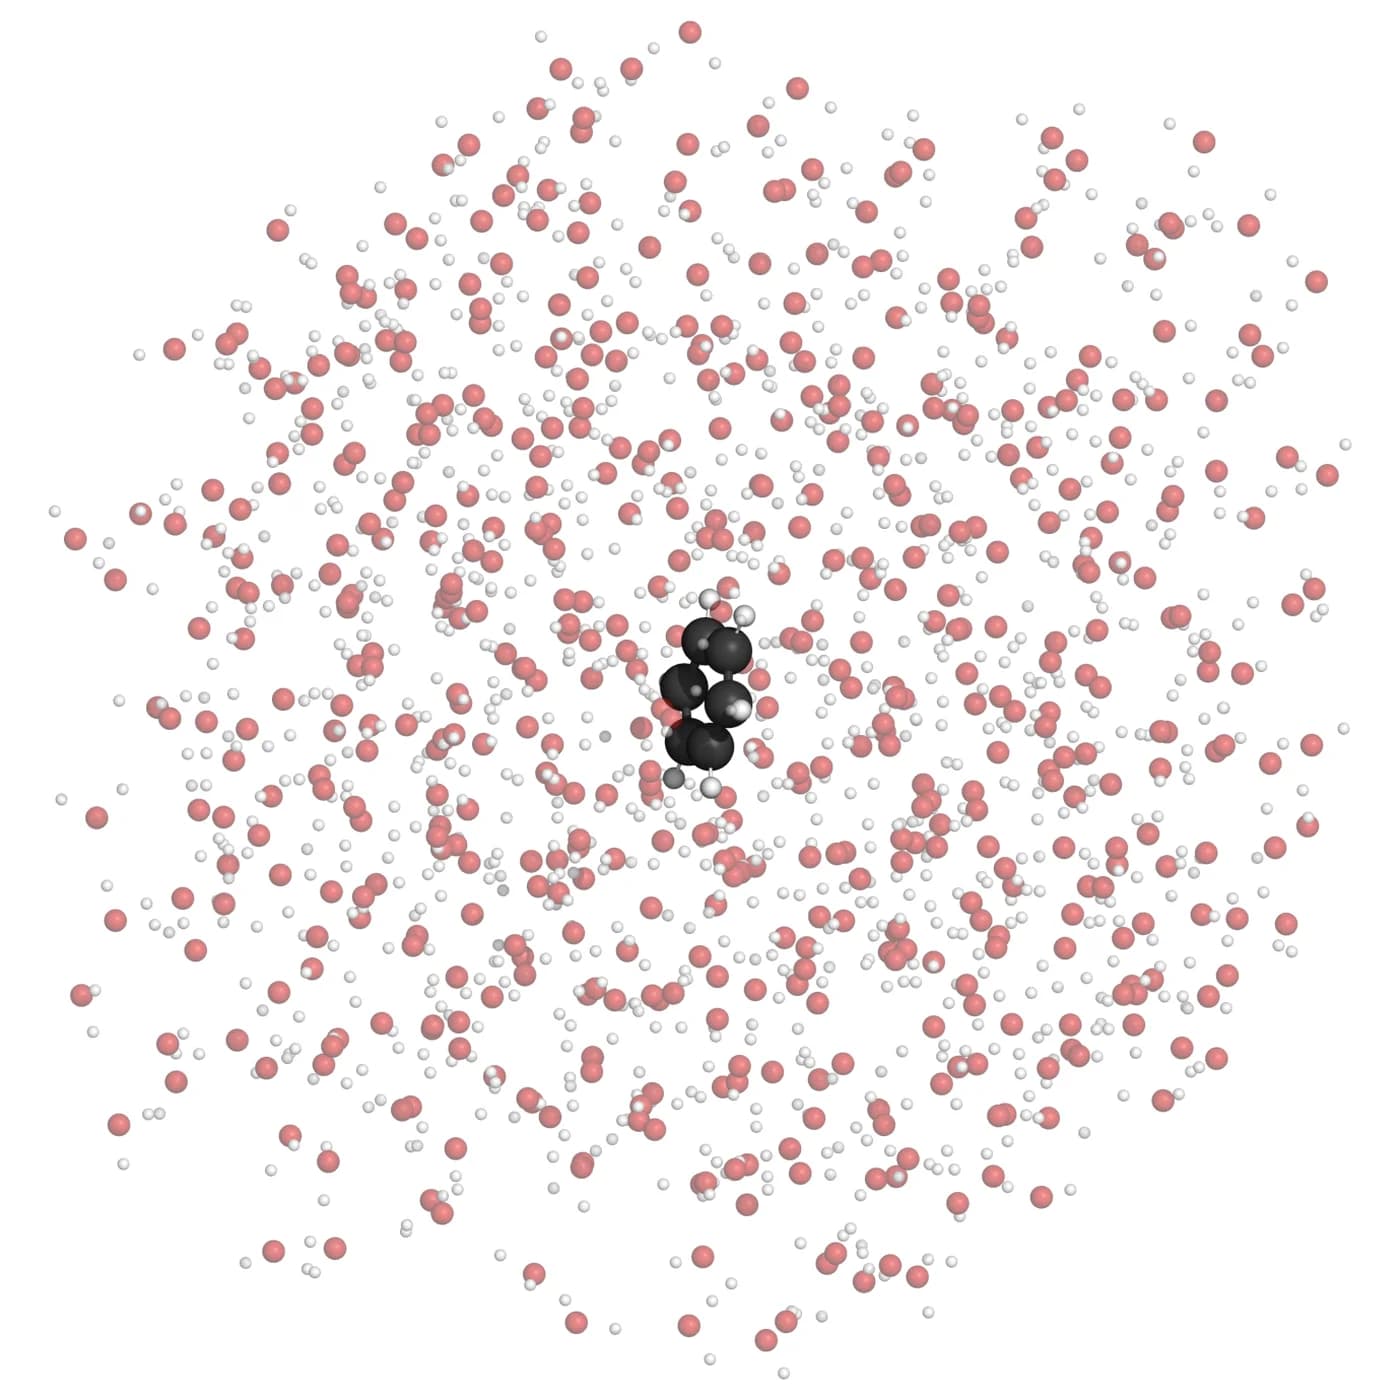
Benzene with 547 TIP3P waters, 1,653 atoms in total. Red spheres are water oxygens, white are hydrogens, dark grey are carbons.
The box is a rhombic dodecahedron with periodic boundaries in all three directions. Waters are unwrapped around the solute, so they form a roughly spherical cloud.
Orthographic projection, CPU ray tracing with ambient occlusion.
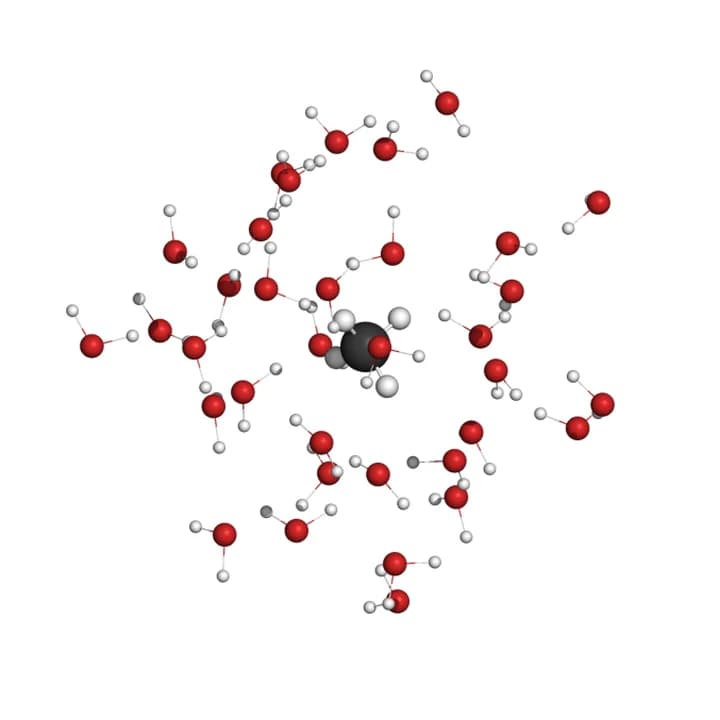
Methane35 waters in the first shell; no solute–water hydrogen bonds 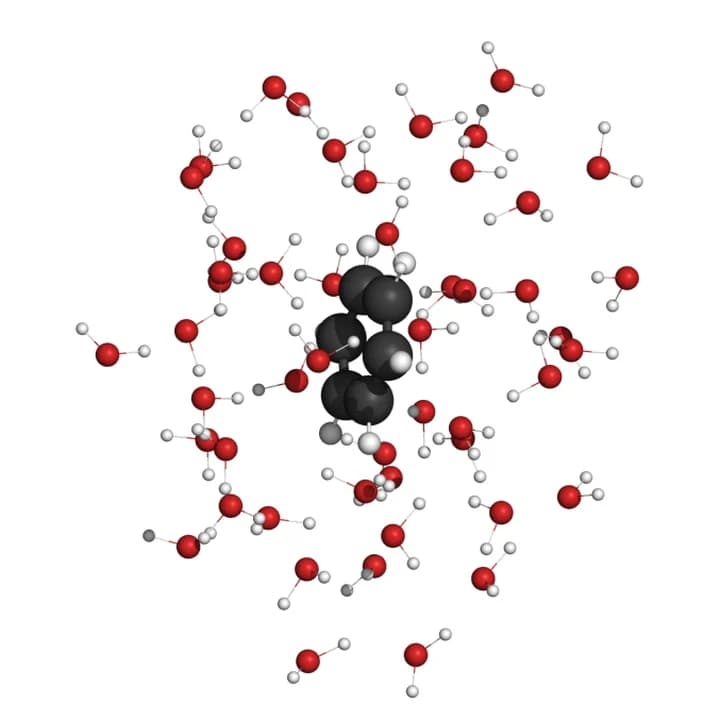
Benzene50 waters in the first shell; no solute–water hydrogen bonds 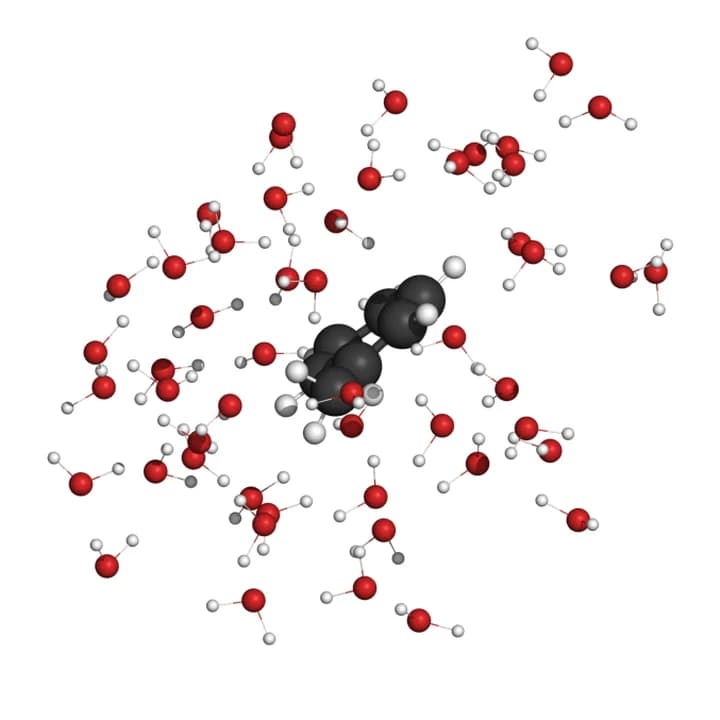
Toluene52 waters in the first shell; no solute–water hydrogen bonds 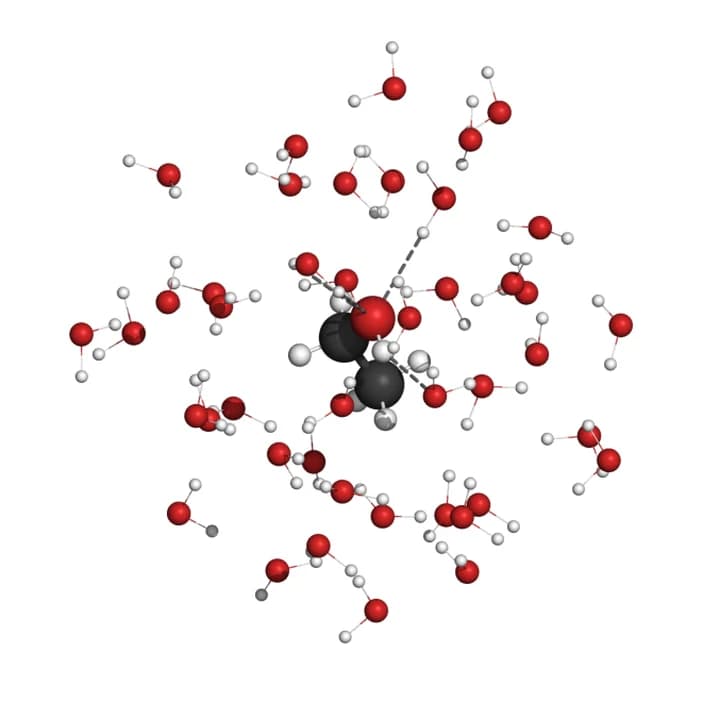
Ethanol43 waters in the first shell; 4 solute–water hydrogen bonds (grey dashes) 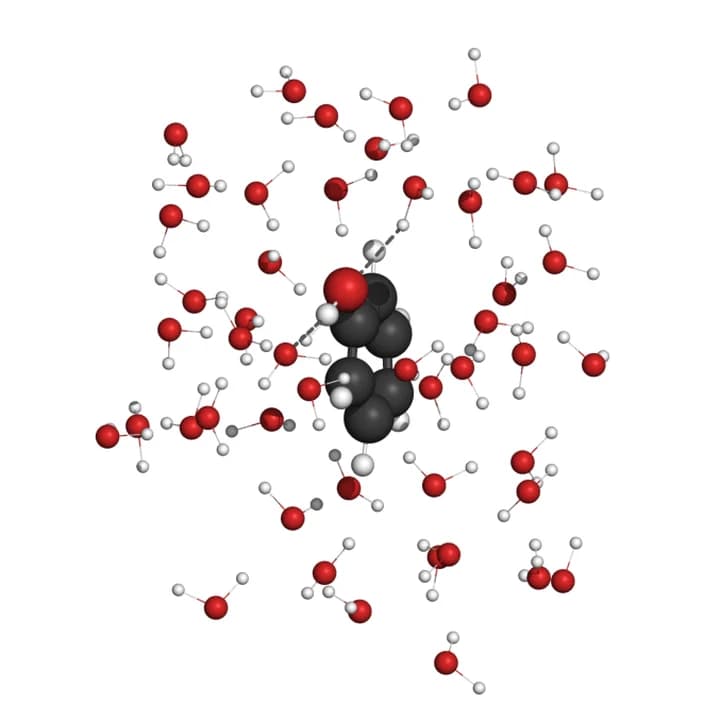
Phenol48 waters in the first shell; 2 solute–water hydrogen bonds (grey dashes) 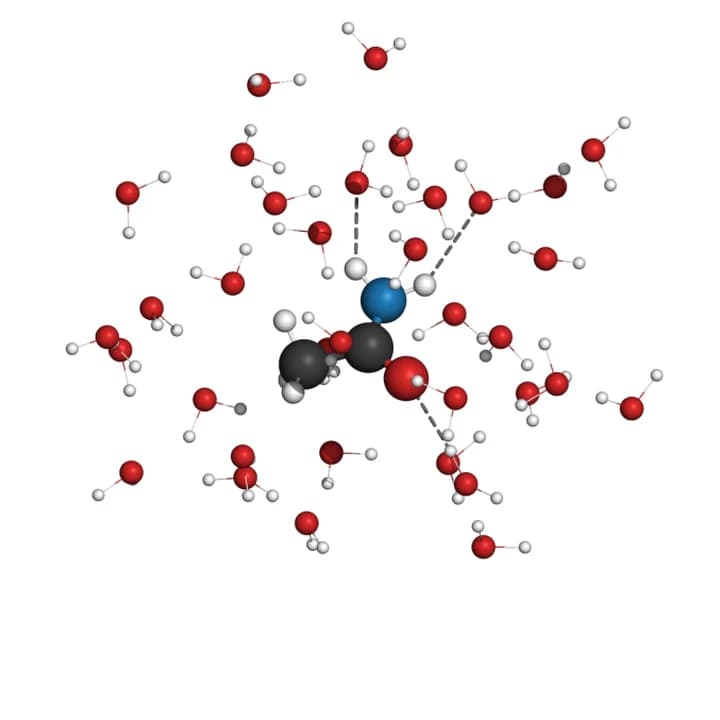
Acetamide35 waters in the first shell; 3 solute–water hydrogen bonds (grey dashes)
Model and parameters
Scientify configured every parameter, from force field to sampling
The values below come from the GROMACS input files used in the run. Each group shows the matching excerpt of the original file; the full production file for benzene at λ state 10 is available at the end of the page.
- Force field
- GAFF
- Atomic charges
- AM1-BCC (official FreeSolv parameter files)
- Water model
- TIP3P
[ atomtypes ];name bond_type mass charge ptype sigma epsilon Ambca ca 0.00000 0.00000 A 3.39967e-01 3.59824e-01 ; 1.91 0.0860ha ha 0.00000 0.00000 A 2.59964e-01 6.27600e-02 ; 1.46 0.0150OW OW 15.9994 0.0 A 0.315061 0.636386HW HW 1.008 0.0 A 0.0 0.0[ atoms ]; nr type resi res atom cgnr charge mass1 ca 1 MOL C1 1 -0.13010 12.01000 ; qtot -0.1307 ha 1 MOL H7 7 0.13010 1.00800 ; qtot -0.650
Workflow
Build, equilibrate, sample and analyse, in order
Each of the 20 λ states of every molecule goes through full equilibration and production before the checked data enter MBAR.
- 1120 states
Build
Read the GAFF/AM1-BCC topologies of six molecules, solvate them in TIP3P water, write inputs for 120 λ states and check each with grompp.
- 218 ns
Equilibrate
Each state runs energy minimisation, 50 ps NVT and two 50 ps NPT stages until temperature, pressure and density settle.
- 370 ns
Sample
Production runs on a T4, with short-range non-bonded forces on the GPU and PME on the CPU; energy differences to all 20 states are written every 0.2 ps.
- 46 molecules
Analyse and check
20-state MBAR after decorrelation, with checks of neighbour overlap and of stability over sampling time. The acetamide estimate was still moving, so Scientify extended it to 1 ns per state.
λ path
Energy derivatives over 120 states
Each curve shows the production average of ⟨∂U/∂λ⟩ at every λ state. When charges are turned off, the starting values follow molecular polarity, from near 0 for methane to about 24 kcal/mol for acetamide. When van der Waals interactions are turned off, each curve shows the typical soft-core dip at λ≈0.75–0.8 and returns to 0 at λ = 1. The minimum MBAR overlap between neighbouring states is 0.07.
Data from windows.csv, along the decoupling direction, in kcal/mol per unit λ.
Results
Hydration free energies of six molecules
The root-mean-square error against experiment is 0.83 kcal/mol, within the common chemical-accuracy target of 1 kcal/mol. Benzene and toluene differ from experiment by 0.02 kcal/mol.
| Molecule | Calculated | Experiment | Calc − exp |
|---|---|---|---|
| Methane | 2.42 ± 0.04 | 2.00 | +0.42 |
| Benzene | -0.88 ± 0.07 | -0.90 | +0.02 |
| Toluene | -0.92 ± 0.08 | -0.90 | -0.02 |
| Ethanol | -3.55 ± 0.07 | -5.00 | +1.45 |
| Phenol | -5.56 ± 0.10 | -6.60 | +1.04 |
| Acetamide | -8.84 ± 0.05 | -9.71 | +0.87 |
RMSE
MUE
R²
Values in kcal/mol; the calculated value carries the MBAR statistical error. Ethanol, phenol and acetamide come out less negative than experiment, a known systematic bias of GAFF/AM1-BCC for polar molecules that the original paper shows with the same method.
Method source
FreeSolv (Mobley & Guthrie, 2014) collects experimental hydration free energies and values calculated with free energy perturbation of small molecules and publishes GAFF/AM1-BCC parameters with GROMACS inputs. Scientify read the paper and the official inputs and extracted the decoupling order, λ path, soft-core parameters, cut-offs and PME settings.
The official inputs target an older GROMACS. Scientify mapped them to GROMACS 2024.4 syntax, such as the van der Waals potential switch and the long-range dispersion correction, and checked every state with grompp. Under the same protocol, methane, benzene, toluene, ethanol and acetamide fall within 0.1–0.3 kcal/mol of the paper’s calculated values.
Input and result files
Files you can download and check
These files come unedited from the workspace of this run.
Scope
Conditions to keep in mind
- Production sampling is 0.5 ns per state (1 ns for acetamide), shorter than the 5 ns of the original protocol.
- Statistical errors come from MBAR and do not include force-field error.
- Atomic charges are the official FreeSolv AM1-BCC parameters and were not recomputed.
- Six small molecules show the full workflow; they are not a benchmark of force-field accuracy.
References
Method and data sources
- Mobley & Guthrie (2014). FreeSolv: a database of experimental and calculated hydration free energies, with input filesJ Comput Aided Mol Des 28, 711–720
- Duarte Ramos Matos et al. (2017). Approaches for calculating solvation free energies and enthalpies demonstrated with an update of the FreeSolv databaseJ Chem Eng Data 62, 1559–1569
- FreeSolvMobleyLab/FreeSolv · GitHub
- alchemlybalchemistry/alchemlyb · GitHub
Hand your computational project to Scientify
Describe the system and the property you need. Scientify configures the model and parameters, rents GPUs for the simulations and delivers results with every input file.